MethodWhat we counted, and how
The cohort is every company on the Companies House register carrying one of four industrial classifications — licensed restaurants (56101), unlicensed restaurants and cafés (56102), takeaway and mobile food (56103), and bakery retail (47240) — with a registered office in a London postcode area. That is 119,220 companies in all, living and dissolved, of which this briefing reports the 75,848 incorporated and the 49,478 dissolved within the calendar years 2018 to 2025. Some London postcode districts extend beyond the Greater London boundary, so London-wide totals include a small number of companies (about 4 per cent) in neighbouring authorities; the borough table shows the thirty-three London authorities only.
Two points of method are worth stating, because they affect every number that follows.
First, the dissolved companies had to be recovered deliberately. The free bulk data that Companies House publishes contains live companies only. A count of formations and removals built on that file alone would show formations rising and removals barely moving — not because companies stopped dissolving, but because dissolved ones are absent from the file. We therefore walked the register itself, postcode district by postcode district, requesting all statuses. Every dissolved company in this briefing is there because it was asked for.
Second, the borough table is computed at single-company addresses only. Rather more than half of the companies in the cohort share their registered address with at least one other company. Accountants’ offices, company formation providers and serviced offices are perfectly ordinary and lawful registered addresses, and a great many small companies use them. For counting purposes, however, an address holding two hundred companies is a professional office rather than a parade of shops, and including it attributes those companies to whichever borough hosts the office. The borough table therefore restricts itself to addresses holding exactly one company from the cohort. Its totals are consequently much smaller than the London-wide figures, and are intended for comparison between boroughs rather than as counts of businesses.
1Formation has outpaced removal in every year
The simplest chart in the briefing, and the one most likely to be quoted, so we would ask that it be quoted with its caveat attached.
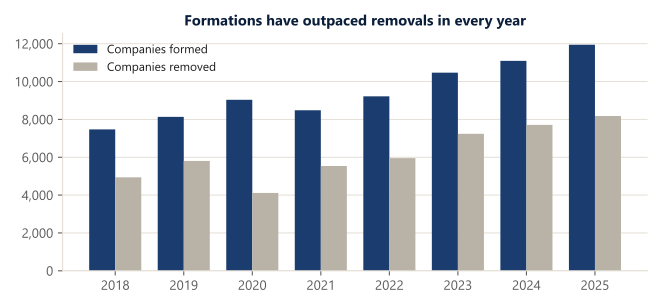
Formation runs ahead of removal in all eight years, and the gap widens after 2022. Removals dipped noticeably in 2020 — a consequence of the temporary pause in strike-off action and in registry activity generally during the pandemic, not of companies becoming more durable — before recovering strongly.
On the register, therefore, London’s food sector has grown consistently. Some 26,370 more food companies were registered than removed over the period. What we would resist is the natural next sentence: that London gained twenty-six thousand food businesses. Rather more than two in five of the companies removed never filed a set of accounts at all, and we have no way of knowing from the public record how many of the formed ones ever opened a door. The register counts registrations faithfully. It does not count shops.
| Formed 2018–25 | Removed 2018–25 | Net | |
|---|---|---|---|
| Takeaway & bakery formats | 33,154 | 21,881 | +11,273 |
| Restaurant & café formats | 42,694 | 27,597 | +15,097 |
| All London food companies | 75,848 | 49,478 | +26,370 |
Table 1. Incorporations and dissolutions by format, calendar years 2018–2025.
2The format mix stepped up in 2020, and stopped
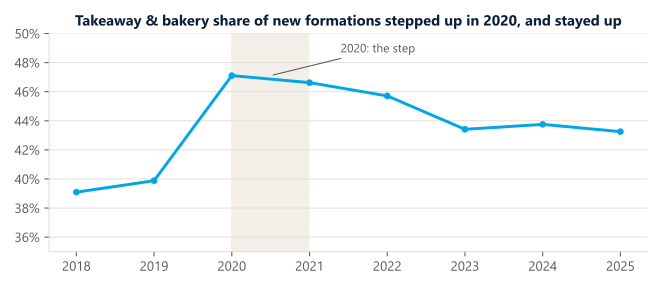
The share of new registrations taking a takeaway or bakery classification moved from 39.1 per cent in 2018 to 47.1 per cent in 2020 — an eight-point shift in a single year, which is a great deal for a composition measure of this kind. It has since drifted to 43.3 per cent, comfortably above where it began but no longer climbing.
The shape matters. This is a step, not a trend: something changed in 2020 and did not change back, but nothing has continued to push in the same direction since. We record the pattern here and leave its explanation to the fuller study, where it is tested against the obvious candidates and, we should say, against our own initial expectations.
Underneath the two-format summary, the four classifications have grown at markedly different rates.
| Classification | Formed 2018 | Formed 2025 | Change |
|---|---|---|---|
| Bakery retail (47240) | 268 | 589 | +120% |
| Unlicensed restaurants & cafés (56102) | 1,954 | 3,579 | +83% |
| Takeaway & mobile food (56103) | 2,653 | 4,578 | +73% |
| Licensed restaurants (56101) | 2,597 | 3,200 | +23% |
Table 2. Incorporations by primary classification, 2018 against 2025.
The licensed restaurant is the laggard of the four by a wide margin — the format that carries the most capital, the most regulation and the most fixed cost. It is worth noticing that the simple takeaway-versus-restaurant division does not capture this: unlicensed restaurants and cafés, which sit on the restaurant side of that division, grew faster than takeaways did.
3How companies leave: strike-off, not insolvency
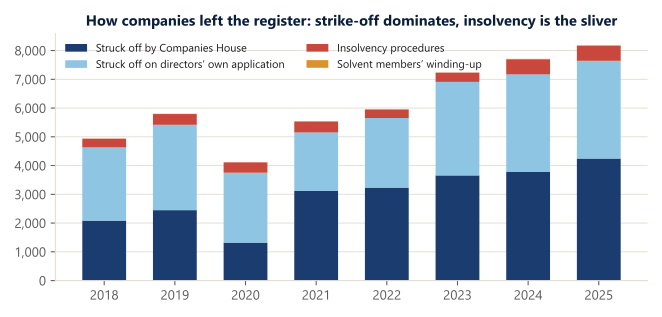
Because the exit route is read from each company’s complete filing history rather than inferred, we can be precise about how the register’s removals actually occur.
| Route off the register | Companies | Share |
|---|---|---|
| Struck off by the registrar | 23,889 | 48.3% |
| Struck off on the directors’ own application | 22,440 | 45.4% |
| Creditors’ voluntary liquidation | 2,389 | 4.8% |
| Compulsory liquidation (court order) | 538 | 1.1% |
| Administration | 123 | 0.2% |
| Other insolvency procedures | 49 | 0.1% |
| Members’ voluntary liquidation (solvent) | 48 | 0.1% |
| Route not determinable from the filing history | 2 | 0.0% |
| Total removals 2018–2025 | 49,478 | 100% |
Table 3. Removals by route, read from each company’s complete filing history, 2018–2025.
Nine in ten companies leave by strike-off, split almost evenly between those the registrar removes when the filings stop and those whose directors apply to have them removed. Formal insolvency — creditors’ liquidation, compulsory winding-up, administration — accounts for 6.3 per cent of removals across the eight years.
We would draw one practical inference and resist another. The practical inference: if one wishes to observe distress in this sector, insolvency statistics will show very little of it, because very little of it goes through an insolvency procedure. The inference we resist is that the rest were therefore healthy. A company that stops filing and is removed by the registrar has told us only that it stopped filing.
4Two in five never reached their first accounts
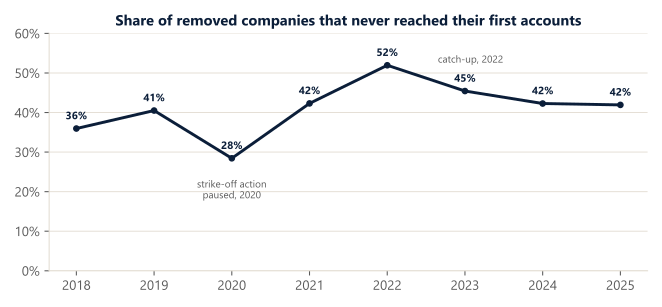
Across the eight years, 41.9 per cent of removed companies left the register before their first accounts had ever fallen due, with no financial information filed at any point. Outside the pandemic years the share has sat between 36 and 45 per cent. It fell to 28 per cent in 2020, when strike-off action was temporarily paused and young companies were not removed on the usual timetable, and rose to 52 per cent in 2022 as that backlog cleared; since then it has settled at around 42 per cent.
It is worth being careful about what this does and does not mean, because it is the figure most open to over-reading in either direction. It does not mean these companies were dormant or fictitious. Nor does it mean they traded. A company may be registered in optimism and abandoned within the year; it may open, struggle and close inside eighteen months; it may be one of several registered by an operator who proceeded with only one. The public record cannot distinguish these, and we shall not pretend otherwise.
What can be said with confidence is arithmetical. Any count of “businesses” that begins with company registrations is, on this evidence, counting a population of which a substantial minority will disappear without ever having shown a figure to anybody. That is worth knowing before the counts are used.
5The boroughs
The table gives formations, removals and the net position for each of the thirty-three London local authorities, computed at single-company addresses only for the reasons set out earlier. The totals are therefore a fraction of the London-wide figures and should be read as a comparison between boroughs rather than as counts of businesses.
| Borough | Formed | Removed | Net |
|---|---|---|---|
| 1. Newham | 891 | 396 | +495 |
| 2. Tower Hamlets | 867 | 398 | +469 |
| 3. Ealing | 719 | 288 | +431 |
| 4. Brent | 686 | 290 | +396 |
| 5. Croydon | 725 | 336 | +389 |
| 6. Redbridge | 681 | 328 | +353 |
| 7. Waltham Forest | 697 | 346 | +351 |
| 8. Enfield | 640 | 294 | +346 |
| 9. Lambeth | 590 | 250 | +340 |
| 10. Southwark | 552 | 237 | +315 |
| 11. Barnet | 675 | 368 | +307 |
| 12. Hackney | 612 | 307 | +305 |
| 13. Westminster | 616 | 312 | +304 |
| 14. Greenwich | 469 | 174 | +295 |
| 15. Lewisham | 589 | 297 | +292 |
| 16. Hillingdon | 514 | 223 | +291 |
| 17. Hounslow | 499 | 224 | +275 |
| 18. Wandsworth | 500 | 233 | +267 |
| 19. Camden | 500 | 235 | +265 |
| 20. Haringey | 556 | 291 | +265 |
| 21. Islington | 530 | 278 | +252 |
| 22. Havering | 429 | 194 | +235 |
| 23. Harrow | 446 | 217 | +229 |
| 24. Hammersmith and Fulham | 405 | 184 | +221 |
| 25. Bexley | 390 | 173 | +217 |
| 26. Bromley | 415 | 203 | +212 |
| 27. Barking and Dagenham | 366 | 155 | +211 |
| 28. Kingston upon Thames | 296 | 118 | +178 |
| 29. Sutton | 288 | 122 | +166 |
| 30. Merton | 292 | 126 | +166 |
| 31. Richmond upon Thames | 249 | 108 | +141 |
| 32. Kensington and Chelsea | 217 | 102 | +115 |
| 33. City of London | 89 | 51 | +38 |
Table 4. Incorporations and dissolutions, 2018–2025, at addresses holding exactly one cohort company. Barnet highlighted.
Every borough is net positive over the period. Newham leads on net additions, followed by Tower Hamlets and Ealing. Barnet — this practice’s own borough, and the one we know best — sits eleventh, with 675 formations against 368 removals.
We would offer one caution about borough rankings generally, and it is not a small one. The ordering of this table is sensitive to how registered addresses are treated. Computed across all addresses rather than single-company ones, several boroughs move a considerable distance, because the boroughs that host the most professional and formation-agent offices accumulate registrations that have little to do with their own high streets. The fuller study measures exactly how far the ranking moves. Until then, we would suggest treating any borough league table built on this register — including ours — with more caution than such tables usually receive.
LimitsWhat this briefing does not tell you
Set out plainly, because a short document travels further than its footnotes.
- Whether any shop opened or closed. We observe companies. Premises are a different thing, recorded elsewhere, and the correspondence between them is imperfect.
- Whether the companies that never filed accounts ever traded. The register is silent, and so are we.
- Whether any company was healthy. A strike-off tells you the filings stopped, and nothing more.
- Why the 2020 step occurred. The pattern is reported here; the candidate explanations are tested in the fuller study, where our own initial hypothesis did not survive.
- Anything about individual companies or clients. No client information of any kind appears in this research.
What follows
This briefing is the counting half of a larger piece of work. The fuller study, The Paper High Street, takes the same frozen dataset and asks the harder question: how closely does this register correspond to the high street it is so often used to describe? It links the company register to the food premises register, measures how much of the sector each can see, and tests what happens to borough rankings and survival comparisons when registered addresses are treated with more care. Some of what it found obliged us to revise conclusions we had reached earlier, and it says so.
We publish this counting exercise first, separately and without argument attached, so that the figures can be checked on their own terms.
StandingMethod, sources and disclosures
- Data
- Companies House public register, walked postcode district by district including all company statuses; complete filing history for every company reported. Observation frozen 18 August 2026; filing histories for CR0 and HA0 retrieved 1 October 2026.
- Definitions
- Formations are incorporations dated in the year; removals are dissolutions dated in the year. An incorporation is not an opening; a dissolution is not a closure. Periods of unequal length are never compared as raw counts.
- Boroughs
- Computed at addresses holding exactly one cohort company, and assigned from the registered-office postcode. Only the thirty-three London local authorities are shown.
- Exit routes
- Classified from complete filing histories. A sample of 200 classifications was re-derived by a second, independently constructed automated classifier; agreement was 96.5 per cent at route level and approximately 99.5 per cent at the level of insolvency versus dissolution. Disagreements were adjudicated individually and one classifier gap was found and fixed.
- AI use
- This research is human-directed and AI-assisted. Roseworth Research originated and directed the study and set its questions, scope, sources, evidential standards, confidentiality rules and publication criteria. Claude (Anthropic) was used extensively as a research, software-engineering, analytical and drafting tool under Roseworth’s direction and review. Every claim derives from public data, published code, reconciliation and documented review. Roseworth Limited is responsible for the publication and any errors. Claude is not an author, and Anthropic did not review, commission or endorse the research.
- Interpretation
- This research analyses administrative records and does not assess the conduct of any company, director, adviser, insolvency practitioner or registered-office provider. A registered office, a change of address, a strike-off, an absence of accounts or an insolvency filing is not treated as evidence of misconduct, concealment, tax avoidance or non-trading; the classifications used are analytical only.
- Interest
- Roseworth acts for businesses in this sector and has a commercial interest in the subject. No client data appears in this research; the analysis rests entirely on public records.
- Standing
- Roseworth Limited is a licensed, supervised and professionally insured accountancy practice. This briefing is general information and not advice.
- Licence
- Contains public sector information licensed under the Open Government Licence v3.0 (Companies House).