Executive summaryBritain measures its high street by counting companies
New registrations are reported as openings, dissolutions as closures, and the register’s addresses are treated as a map of where enterprise lives and dies. We set out to use the register the same way. This report is what happened when we checked it against the trade it is supposed to describe.
Five findings carry the report.
- Borough rankings depend materially on how registered-office addresses are treated.Ranked by the share of young food companies that vanish before their first accounts fall due, Hackney appears to lead London. Set aside the addresses at which many companies are registered — professional offices rather than shops — and Hackney falls to the lower half of the table, while Hounslow takes its place. Across our two headline measures, 25 of 26 and 28 of 30 boroughs change rank on that single step, and half of the affected companies sit at just 418 addresses.
- Two in five removals never reached their first accounts.A company’s first accounts fall due some twenty-one months after incorporation. Of the companies that left the register in our window, 41.9 per cent left before that day arrived, having filed no financial information at any point. Whether they traded is not knowable from public data, and we decline to guess in either direction.
- Registered-office location can change materially during insolvency proceedings.Of companies entering formal insolvency, 80.8 per cent moved their registered office on or after the day proceedings began — typically to the practitioner’s office, which is proper procedure. Any map of failure drawn from current registered addresses is, in material part, a map of insolvency practitioners.
- Registered-office data maps only partially onto physical food premises.Among food establishments trading under their company’s own name — the only ones matchable by name, and 7.3 per cent of the premises register — fewer than half of restaurants sit inside the register-defined universe this study itself began with. Read from the premises side the same gap appears: only 23.1 per cent of London’s 70,470 food establishments have any cohort company registered at their address at all.
- Formats subject to different VAT treatment show different register-survival patterns.Of food companies incorporated since April 2022, 40.4 per cent of takeaway and bakery formats remained on the register three years later, against 48.9 per cent of restaurants and cafés. The gap holds in every period and every specification we tested, and widens among companies that demonstrably filed accounts. The difference is concentrated in strike-off and removal rather than formal insolvency.
Three things this study cannot establish, stated as plainly as the findings: whether any of the pre-deadline companies traded; whether any shop opened or closed, since we observe companies and not premises; and any causal effect of VAT on formation, survival or premises use. The tax thesis with which we began is examined in section 7 and put down.
At a glanceThe numbers
| Measure | Result | What it means |
|---|---|---|
| Companies examined | 119,220 | Registered at London addresses; not necessarily shops |
| Exits classified from filing histories | 61,717 (100%) | Route read from each complete filing history |
| Removals never reaching first accounts | 41.9% | No financial information ever filed |
| Boroughs changing rank between readings | 25/26 and 28/30 | Rank correlations of 0.34 and 0.53 |
| Insolvent companies moving office once proceedings began | 80.8% | The record relocates when the company fails |
| Establishments with any cohort company at their address | 23.1% | Of 70,470 London food premises |
| Three-year register survival, 2022 cohort | 40.4% v 48.9% | Counter v service; gap 8.5 points |
| Adjusted exit odds, counter formats | 1.34 [1.31–1.37] | After era, address type and geography |
| Three-year survival from first accounts | 67.6% v 77.3% | The gap widens among proven filers |
| Three-year insolvency incidence | 0.28% v 0.73% | Difference of 0.45 points [0.33–0.56] |
Every figure derives from public records frozen on 18 August 2026 and can be reproduced from the published pipeline. Figures describing the food-premises linkage rest on the subset of establishments matchable by name, and are labelled as such wherever they appear.
1Borough rankings and registered addresses
We begin with the demonstration, because it contains the argument in miniature.
Put a reasonable question to the public register: in which London borough do the most young food companies come to nothing? Count every company at its registered address, as the published rankings that appear in the press every few months do, and the answer is Hackney, comfortably ahead of the field.
Hackney, however, is where a great many London companies are registered rather than only where London eats. A single office in Shoreditch may lawfully house several hundred companies that have nothing to do with one another. Restrict the same count to addresses holding exactly one company from the cohort — where a registration plausibly corresponds to one business in one place — and Hackney falls from first to twenty-first of twenty-six. Hounslow, second on the first reading, takes the top position, with Ealing — ninth as registered — close behind. Nothing about London changed between those two sentences. A classification step did.
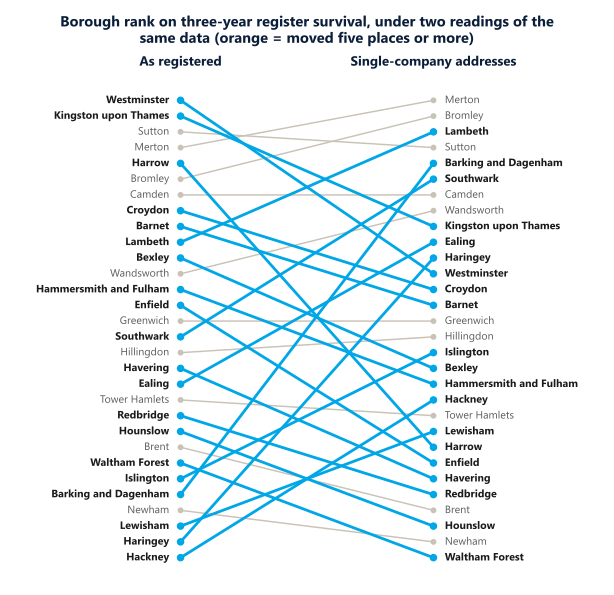
Run systematically across the boroughs that pass our sample floors, 25 of 26 change rank on the pre-deadline measure and 28 of 30 on the survival measure. Eight boroughs move ten places or more on the first measure and seven on the second. The rank correlation between the two readings is 0.34 on one measure and 0.53 on the other — closer to reshuffling the table than to adjusting it. The movement is concentrated rather than diffuse: of the 27,507 dissolved companies registered at shared addresses, half sit at just 418 of them.
One caution, which we would ask readers to carry through the rest of the report. This experiment shows that the answer is unstable across defensible readings of the same data. It does not crown one reading as correct. The premises-confirmed reading, which we discuss shortly, is itself a selected subset and is labelled as such wherever it appears. The finding is the instability, not the substitution of one league table for another.
2What we built
The cohort is every company on the register carrying one of four industrial classifications — licensed restaurants, unlicensed restaurants and cafés, takeaway and mobile food, and bakery retail — with a registered office in a London postcode area: 119,220 companies, living and dissolved, observed to August 2026.
Two definitional points belong here rather than in a footnote. Some London postcode districts extend beyond the Greater London boundary, so 4,436 companies (3.7 per cent) sit in neighbouring authorities; London-wide totals include them, and every borough-level figure is restricted to the thirty-three London authorities. And because companies enter the cohort by their latest registered office and industry code, the survival estimates describe companies so classified, conditional on that later classification — not a cohort fixed at the moment of incorporation.
The dissolved companies had to be sought deliberately, and this is worth a paragraph because it invalidates a good deal of casual analysis. The free bulk data product that Companies House publishes contains live companies only. A survival analysis built on that file alone is biased by construction: the companies that failed are simply absent, and the ones that remain look remarkably durable. We therefore walked the register itself, postcode district by postcode district, requesting all statuses, and every dissolved company in this study is present because it was asked for.
For each company we hold the complete filing history, together with registered-office histories reconstructed from change filings, parsed accounts for 50,206 filers, and a linkage to the Food Standards Agency’s register of food establishments. Every response was cached and the observation frozen, so any figure here can be regenerated exactly.
A point of precision about the universe, which we would rather make ourselves than have made for us. The cohort is defined by the registered address — the very variable this report goes on to distrust. It is therefore a population of companies registered at London addresses, which is not the same thing as London food businesses. The distance between those two populations is not a footnote to be tidied away. It is one of the results.
3The register is not the high street
Three measurements, each of a different distance between the record and the thing recorded.
Where the record points
When a company enters formal insolvency, the record itself tends to move. An insolvency practitioner administers the estate from their own office, and the registered office follows; there is a procedure for exactly this. We decomposed the moves by timing, because a move after proceedings begin means something quite different from a move during ordinary trading.
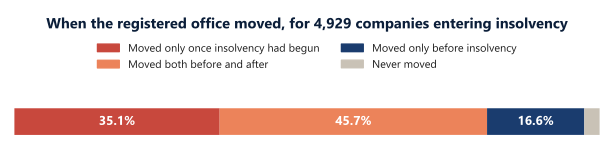
Some 80.8 per cent moved on or after the day proceedings began; 62.3 per cent had also moved at some point during ordinary life; only 2.6 per cent never moved at all. The consequence is unglamorous and far-reaching. A map of business failure drawn from today’s registered addresses is, in significant part, a map of the professional firms that administer failures. The towns that recur in our data — Nottingham, Oxford, Brighton, Reading — are where national professional-service providers are based. There is nothing improper in any of this; it is simply not a map of shops, and it is read as one regularly.
What the labels say
Companies choose their own industrial classification, and nobody checks it. Matched against what the food-hygiene inspector actually recorded at the premises, those self-declarations are right perhaps two-thirds to three-quarters of the time. Running the check in the opposite direction is more revealing still.
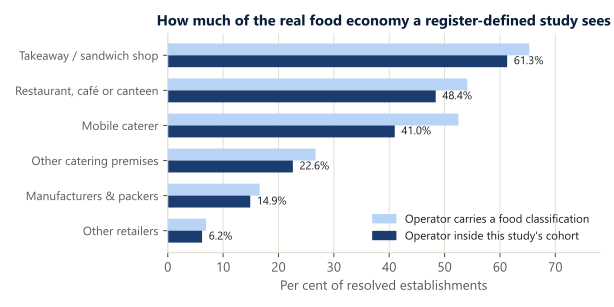
Among London food establishments trading under their company’s own name, only 48.4 per cent of restaurants and cafés, and 61.3 per cent of takeaways, appear inside the register-defined food cohort that this study itself began with. The others are on the register — they simply carry a different classification, or a registered office outside London. Real bakeries classify themselves as manufacturers. Cafés classify themselves as contract caterers. The operator of a food premises may be registered two counties away under retail sale via the internet.
Approached from the premises side rather than the company side, the same gap appears with no name-matching involved at all: of the 70,470 food establishments on the London hygiene register, only 23.1 per cent have any company from our cohort registered at their address. Any study built from food classification codes therefore starts approximately half-blind. That includes this one. The difference is that here the blindness has been measured.
The named and the unnamed
We should be candid about the limits of that measurement. Matching by name can only reach establishments whose trading name contains their company’s name — 5,152 of London’s 70,470 food establishments, or 7.3 per cent, and plausibly the subset most willing to display its legal identity. For the remaining nine in ten, names cannot resolve, but addresses can be tested: among a sample of four thousand, only 16 to 20 per cent have even a single cohort company registered at the premises address. Outside the measurable slice, so far as we can see, the blind spot deepens rather than closes.
4Filed and forgotten
A company’s first accounts fall due some twenty-one months after incorporation. Of the companies that left the register between 2018 and 2025, 41.9 per cent left before that day ever arrived, with no financial information filed at any point. The register records their beginning and their deletion, and nothing in between.
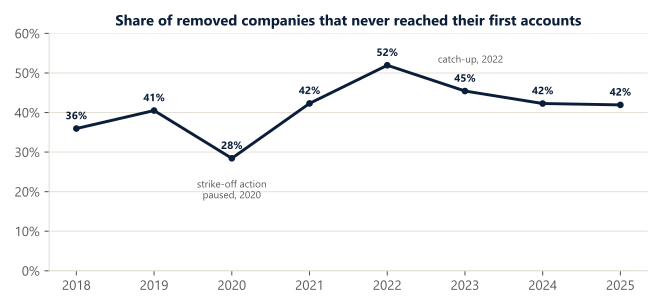
We are deliberate about what this does and does not mean, since it is the figure most open to over-reading in either direction. It does not mean these were fictitious businesses, and it does not mean they were real ones. Some will have been registered in optimism and abandoned within the year; some will have opened, struggled and closed inside eighteen months; some will have been one of several companies registered by an operator who proceeded with only one. The public record cannot distinguish between them, and neither shall we.
What can be said with confidence is arithmetical, and it is the point of the chapter. Any count of “businesses” that begins with company registrations is counting a population of which a substantial minority will disappear without ever having shown a figure to anybody.
Measured at single-company addresses, Hounslow has London’s highest share at 43.3 per cent of its food-company removals, with Ealing and Hammersmith & Fulham close behind. Counted at all addresses, this chapter would have been about Hackney — which is section 1 again, arriving from a different direction.
5The survival case study
Here the original thesis met the data, and here the measurement machinery earns its keep.
Of food companies incorporated since April 2022, 40.4 per cent of counter-format companies remained on the register three years later, against 48.9 per cent of service-format companies — a gap of 8.5 percentage points. The formats that enjoy the VAT advantage leave the register faster than those that do not.
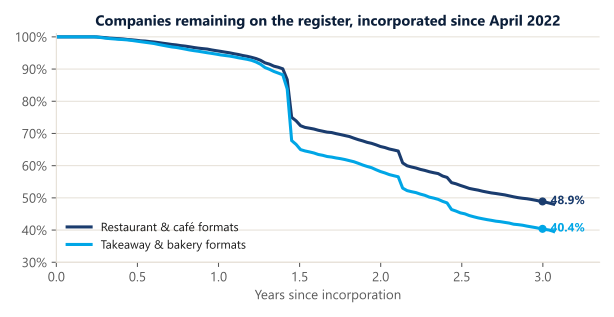
The visible cliff a little before the eighteen-month mark deserves a note in passing, since it is a fine illustration of this report’s theme: it is not a wave of failures but the registrar’s timetable, the point at which companies that have filed nothing begin to be struck off. Even the shape of a survival curve, in this data, is partly administrative.
The gap itself declines to go away under interrogation. It appears in all four periods of the study. It survives seven alternative specifications, including restriction to premises-confirmed companies and the deliberately destructive reading that counts every café as a counter format.
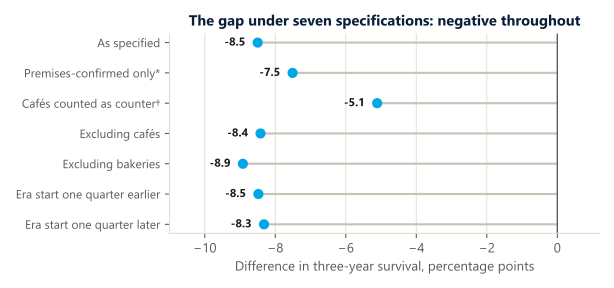
Stratified across period, address type and geography the gap persists, with observed exits among counter formats running 14 per cent above expectation. In a discrete-time model adjusting for those recorded characteristics, the counter format’s odds of exit are 1.34 times those of service formats, with an interval of 1.31 to 1.37. Composition the data cannot see — capital, experience, the founder’s intentions — remains uncontrolled, and we would not pretend otherwise.
The most instructive specification starts the clock at each company’s first filed accounts, so that everyone in the frame demonstrably existed and filed something. There the gap widens, to 67.6 against 77.3 per cent at three years. Whatever else it is, the difference is not an artefact of paperwork churn.
That same frame corrected one of our own earlier conclusions, which we record because it illustrates the method. Bakery retail showed the worst raw survival of the four classifications, and we had written that up. Conditioned on having filed accounts, bakeries perform much like cafés, at 75.5 per cent. Their dreadful headline figure was pre-deadline churn rather than trading failure. The measurement lesson cuts in every direction, including ours.
6How food companies end
There are five ways off the register, and because we hold every company’s complete filing history we can classify each exit rather than infer it: struck off by the registrar; struck off on the directors’ own application; creditors’ voluntary liquidation; compulsory liquidation by order of the court; and the members’ voluntary liquidation, which is a solvent winding-up and a retirement rather than a failure.
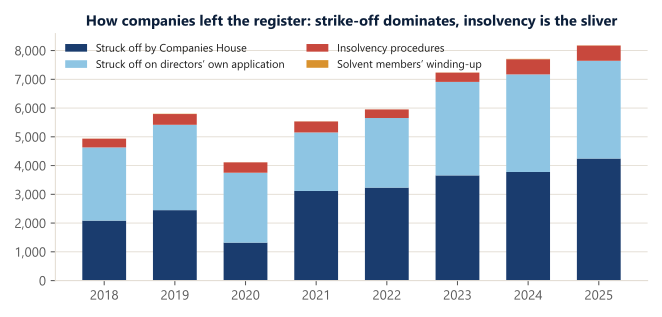
The format difference lives almost entirely in the quiet routes. Between counter and service formats the difference in ordinary dissolution is around ten percentage points; the difference in formal insolvency is under one point — 0.28 against 0.73 per cent at three years, with an interval of 0.33 to 0.56 points on the difference. When a takeaway-format company ends, in the overwhelming majority of cases nobody files anything at all. When a licensed restaurant ends, creditors are in the room some three times as often, among companies that had filed accounts — a comparison we always state conditionally, because reaching one’s first accounts is itself a form of survival.
The secured-borrowing figures point the same way. Service-format companies grant a registered charge at between two and three and a half times the rate of counter formats in every period — proportions only; we make no claim about amounts. Both patterns are consistent with capital intensity separating these formats rather more cleanly than tax treatment does.
The difference between these formats is not how often they fail, but how often they simply stop.
7What London builds now, and the thesis we put down
The counter share of new food registrations stepped from 39.1 per cent in 2018 to 47.1 per cent in 2020 and has settled near 43.3 per cent — a permanent change in level. The question is what produced it, and here our founding thesis received its answer.
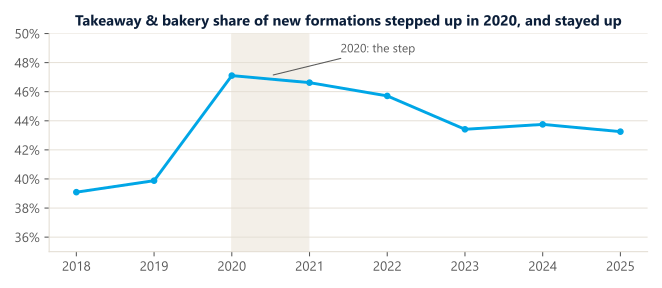
Dated precisely, the step falls in the second quarter of 2020 — the first lockdown — while eat-in VAT still stood at 20 per cent. Through the eighteen months that followed, when the Treasury reduced hospitality VAT to 5 and then 12.5 per cent and thereby closed most of the boundary on which our thesis rested, the counter share fell. When the boundary returned to its full width in April 2022, the share continued to drift downwards. A boundary that was in place before the change, throughout it and after it cannot be what selected it.
The control test settles what remains. Five sectors with no equivalent VAT boundary — hairdressing, management consultancy, clothing retail, fitness facilities and public houses — reproduce the same ordering: formats that are cheap to start grew strongly, and licensed premises lagged. Comparing three-year averages for 2017–19 and 2023–25, public houses grew 22 per cent against licensed restaurants’ 20, on the same streets, under the same licensing regime, with no zero-rating anywhere in sight.
A smaller finding underneath that one interests us more. Split the four classifications apart and the laggard is not the restaurant in general but the licensed restaurant in particular — up 23 per cent since 2018, against 73 per cent for takeaways, 83 for unlicensed restaurants and cafés, and 120 for bakeries. Capital, licensing and fixed cost divide these formats considerably more cleanly than the tax boundary does.
What the boundary can still speak to is the standing level rather than the change: why counter formats were already two-fifths of new food companies before anybody had heard of hybrid working. That is a different and more modest claim than the one we set out to make, and it belongs to the companion paper on the boundary itself.
8Eight years on the balance sheets
Fifty thousand of these companies filed accounts, and read together those filings tell their own story — one that arrives with a lag.
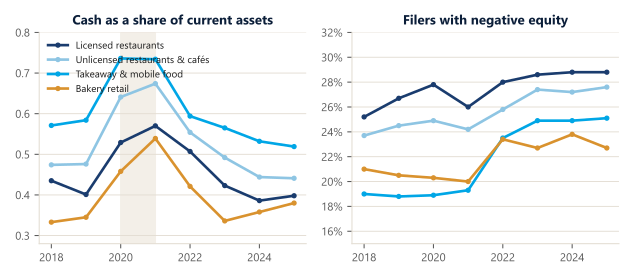
Cash on London food companies’ balance sheets swelled in 2020 and 2021 as support money arrived, then drained through the cost-of-living years to at or below where it had started. The share of filers whose liabilities exceed their assets has ratcheted upward since 2021 in every format, and most steeply among takeaways, from 19.0 to 25.1 per cent. The median filer’s equity has barely moved since 2022; in 2025 the median restaurant-format filer grew by nothing at all.
Two cautions, since these are cross-sections rather than a panel. The composition of the filing population changes each year as entrants join and leavers depart, so a movement in the line is not necessarily a movement in any given company. And small companies file up to nine months after their year end, so the 2025 column is still filling; its level understates, and only its shape should be read.
One further observation, which surprised us. Read as a panel — the same company one year against the next — the median change in employees is zero in every year and every classification. The falling average headcount visible in the cross-section is composition, a growing population of very small filers, rather than businesses shedding staff. It is the kind of distinction that separates a real finding from a headline.
9The boundary, briefly
The VAT schedule’s shape is real enough. Catering and hot takeaway food are standard-rated; cold takeaway food is largely zero-rated. Hot takeaway food has been standard-rated since 1984, when the gap was fifteen points; it has been twenty points wide only since January 2011, and it narrowed on the eat-in side during the pandemic reliefs.
The familiar arithmetic — the takeaway keeping the whole of a ten-pound note where the restaurant keeps eight pounds thirty-three — is the boundary’s theoretical maximum rather than its width in any real business. Modelled across audited accounts, the four largest counter operators retain between £8.55 and £8.82 of every £10 of consumer spending. Greggs, by virtue of the rule that a sausage roll cooling on a rack is zero-rated while the same roll from a hot cabinet is not, may retain as much as £9.34. On public information alone, where in that range the truth sits is known only to Greggs. Paper 2 sets out the model in full.
10What changes from here
Companies House is part-way through the most substantial reform in its history under the Economic Crime and Corporate Transparency Act 2023 — registered-office requirements from March 2024, identity verification from November 2025, and fuller small-company accounts to follow. This study is therefore a baseline spanning the period before and during early implementation: a picture of what the register showed, and could not show, as the reforms began.
Repeating the measurement once they have matured is the obvious sequel, and the annual index this report inaugurates is built to do it. We describe the reforms and recommend nothing. For the avoidance of doubt, this report proposes no new filing obligation on any business.
11The view from practice
12What this study cannot say
- Whether any of the pre-deadline companies traded. The register is silent, and so are we.
- Whether shops opened or closed. We observe companies; premises are inferred only where independently confirmed, and that confirmation covers a minority.
- Any causal effect of VAT on formation, survival or premises use. The natural experiment was confounded, and the control sectors declined to cooperate with our hypothesis.
- Whether a company that left the register was healthy or otherwise. A strike-off tells you the filings stopped.
- Anything whatever about individual companies or clients. That is a rule rather than a limitation.
13Method, validation and corrections
The full pipeline — sources, filters, estimators and code — publishes alongside this report. Every response from the public registers was cached and the observation frozen, so the study reproduces to the digit. Survival is estimated by the Kaplan–Meier product-limit method, with Aalen–Johansen cumulative incidence where exit routes compete. Comparisons report effect sizes with intervals. Medians are preferred to means throughout, and periods of unequal length are compared only as rates.
Validation
Validation here is assisted rather than manual, and we label it so. A second, independently constructed automated classifier re-derived all 200 sampled exit classifications, working from the sequence and description of filings rather than their set. Agreement was 96.5 per cent at the level of the specific route and approximately 99.5 per cent at the level that matters for our findings — insolvency against dissolution. Every disagreement was adjudicated individually, and the exercise found and fixed a genuine gap in our classifier, where certain court winding-up forms had been missed.
The premises linkage was probed hard enough to make us restate it more modestly. Because pairs are formed on address, the address components agree by construction, and only six of the two hundred sampled pairs share any name evidence. We therefore describe a premises match as confirming a food establishment at the company’s address, not as confirming that the company operates it.
Corrections
Twenty-one corrections were made between the first draft and this version, and the full log follows. Among them: a wrong estimator; a pattern match that confused voluntary with registrar-led strike-off; a branch of the classifier that made solvent liquidations unreachable; an inconsistent observation window; two postcode districts never collected at all, and whose filing histories were then missed by the exit classification; a premises table that counted address keys rather than establishments, caught by external review; companies in live insolvency proceedings whose exits were timed at the observation date rather than at the filing that began the proceedings; and a stock projection whose survival assumption made older companies immortal, now withdrawn.
Four of those corrections changed figures between the August draft and this version, and we set them out rather than quietly restating. Correcting the event dates moved three-year survival from 40.6 and 49.4 per cent to 40.4 and 48.9, narrowing the gap from 8.8 points to 8.5; it also roughly doubled measured insolvency incidence in both formats, because exits that had been censored at the observation date now register when the insolvency actually began. Correcting the premises table left the company-side match rate unchanged — it had always counted distinct companies — but made the establishment-side figures correct for the first time, which is where the 23.1 per cent in section 3 comes from. Classifying the 1,452 exits in central Croydon and Wembley, whose filing histories had not been retrieved, brought the classified total to 61,717, moved service-format insolvency incidence from 0.72 to 0.73 per cent, and lifted the rank correlation on the survival measure from 0.50 to 0.53; the address-timing figures moved from 81.1 to 80.8 per cent. And a borough-level figure carried over from an early draft — Newham at 49.5 per cent as the leading borough on pre-deadline exits — was found not to match the final data, in which Hounslow leads at 43.3 per cent; the text now follows the data.
Headline rates and every direction survived. Several counts, intervals and labels did not, and the log says which. We publish it because a study that shows its corrections is worth rather more than one that claims to have needed none, and because the alternative — discovering them after publication — is worse for everybody.
AppendixThe corrections log
| # | What was wrong | What changed |
|---|---|---|
| 1 | Kaplan–Meier treated strike-off as censoring when it is a competing exit | Replaced by Aalen–Johansen cumulative incidence |
| 2 | A prefix match on gazette form GAZ1 also captured the voluntary GAZ1(A) | All exits reclassified; registrar and voluntary strike-off separated |
| 3 | Premises address keys built from the first address line only | Match rate at ordinary addresses rose from 1.4% to 30.4% |
| 4 | The current registered office was used as the historical location | Address histories reconstructed from change-of-address filings |
| 5 | A weak accounts tag (working capital) overwrote shareholders’ equity in 88% of figures | Equity preferred; balance-sheet series rebuilt |
| 6 | “2.7 times the secured borrowing” was 2.7 times the proportion with a charge | Restated as proportions only; no claim on amounts |
| 7 | A zero-rating “headroom” ordering was described as predicted in advance | Relabelled as constructed during analysis; exploratory only |
| 8 | Conditional insolvency computed on exited filers rather than all filers | Recomputed on all filers; the earlier figures withdrawn |
| 9 | A snapshot “proposal to strike off” label overrode the register’s later “dissolved” status | 2,211 companies relabelled; counts reconcile exactly |
| 10 | The solvent members’ voluntary liquidation branch was unreachable | 134 solvent wind-ups no longer counted as insolvency |
| 11 | Survivors censored at one date while deaths were counted to another | Single observation window; every survival level re-estimated |
| 12 | Two postcode districts (CR0, HA0) never collected: a loop began at one, not zero | Districts walked; cohort 116,411 → 119,220 |
| 13 | An “87.8% of insolvent companies mislocated” figure ignored timing | Decomposed by timing; moves after proceedings reported separately |
| 14 | A survival cut by accounting framework used a live-register field, and a loan metric had near-zero tag coverage | Both analyses discarded |
| 15 | Certain court winding-up forms were missed by the exit classifier | Found by assisted validation; classifier fixed |
| 16 | A register-stock projection made older companies immortal | Projection withdrawn |
| 17 | Bakery retail’s raw survival was written up as trading failure | Conditioned on filing, bakeries perform like cafés; claim withdrawn |
| 18 | The premises table counted candidate address keys, not establishments | Caught by external review; 231,089 rows were 70,470 establishments |
| 19 | Exits in live insolvency proceedings were timed at the observation date | Event dates read from the first insolvency filing |
| 20 | Filing histories for the CR0 and HA0 companies were never retrieved, so their exits were unclassified | Histories retrieved 1 October 2026; exits classified; downstream figures re-run |
| 21 | The leading borough on pre-deadline exits (Newham, 49.5%) was carried over from an early draft and did not match the final data | Restated from the final rank-reversal output: Hounslow, 43.3% |
StandingSources, review and disclosures
- Sources
- Companies House register (Advanced Search API, walked by postcode district, all statuses), filing histories, charges and accounts (Accounts Monthly Data, iXBRL); Food Standards Agency food hygiene rating data; Transport for London. Observation frozen 18 August 2026; filing histories for CR0 and HA0 retrieved 1 October 2026.
- Review
- The method and statistics were examined in three independent written reviews, each answered point by point and adopted, and the headline figures were additionally audited by adversarial recomputation against the frozen database.
- AI use
- This research is human-directed and AI-assisted. Roseworth Research originated and directed the study and set its questions, scope, sources, evidential standards, confidentiality rules and publication criteria. Claude (Anthropic) was used extensively as a research, software-engineering, analytical and drafting tool under Roseworth’s direction and review. Every claim derives from public data, published code, reconciliation and documented review. Roseworth Limited is responsible for the publication and any errors. Claude is not an author, and Anthropic did not review, commission or endorse the research.
- Interpretation
- This research analyses administrative records and does not assess the conduct of any company, director, adviser, insolvency practitioner or registered-office provider. A registered office, a change of address, a strike-off, an absence of accounts or an insolvency filing is not treated as evidence of misconduct, concealment, tax avoidance or non-trading; the classifications used are analytical only.
- Interest
- Roseworth acts for businesses in this sector and has a commercial interest in the subject. No client data of any kind appears in this study; the analysis rests entirely on public records.
- Errata
- This is version 1.0. Corrections after publication are made in dated revisions at the same address, with the change recorded.
- Licence
- Contains public sector information licensed under the Open Government Licence v3.0 (Companies House; Food Standards Agency; Transport for London).
- Standing
- Roseworth Limited is a licensed, supervised and professionally insured accountancy practice. This report is general information and not advice.

In practice, the strike-off that a statistician counts as a death is frequently a retirement. The “closure” is a reopening next door under a new company. The dormant company is a lease being kept warm, or a name being held, or an argument between shareholders that has not yet resolved itself. Accountants watch the space between the register and the business every working day, which is partly why this study was possible and entirely why we found its central finding easier to believe than we might have done otherwise.
It also shapes what we think is worth saying to operators: the things that appear to matter in this data are cash buffers, the shape of one’s creditors, and the difference between closing a company properly and letting it lapse.